Tip #156: Measure CPU Performance on Your Mac
… for Random Weirdness
Tip #156: Measure CPU Performance on Your Mac
Larry Jordan – LarryJordan.com
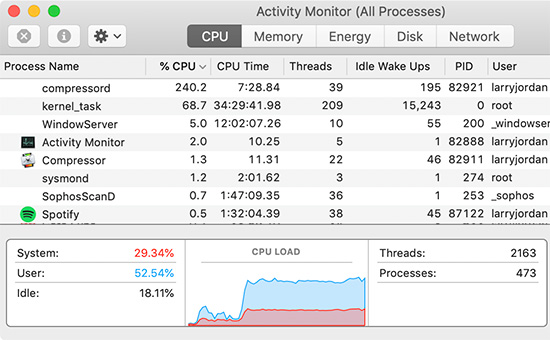
Activity Monitor displays how hard your CPU is working.

Hidden in Applications > Utilities is a powerful measurement tool called: Activity Monitor.
- Type Shift + Cmd + U to open the Utilities folder. Double-click Activity Monitor to start the app.
Activity Monitor allows us to measure current activity in five key areas:
- CPU
- Memory (RAM)
- Energy
- Disk (local storage)
- Network (both Internet and other network-connected devices)
Click the CPU tab at the top to display all the software currently running on your system. You won’t recognize most of these, because many of the programs your Mac runs are background tasks.
The graph at the bottom (see the screen shot) shows total CPU effort called “CPU Load.” Red indicates tasks running under the control of the operating system. Blue shows tasks that you have started. The maximum CPU % is based on the number of cores in your computer times 100. So a four-core system has a maximum of 400% CPU activity.
I often look at this to see what my CPUs are doing and how hard they are working. This also allows me to cancel any non-critical tasks that are using up too much CPU time.
BONUS
You can also see CPU usage or history in a separate window or in the Dock:
- To open a window showing current processor activity, choose Window > CPU Usage. To show a graph of this information in your Dock, choose View > Dock Icon > Show CPU Usage.
- To open a window showing recent processor activity, choose Window > CPU History. To show a graph of this information in your Dock, choose View > Dock Icon > Show CPU History.
Energy usage related to CPU activity is incorporated into the energy-impact measurements in the Energy tab of Activity Monitor.
On PC’s the Task Manager has similar functionality,
Chris:
Thanks for letting me know – I figured it did, but I didn’t know what it was.
Larry
Always like to understand the meaning behind the numbers. Still not sure I understand the %CPU. I have an 8 core 2019 27″ iMac w i9 chip & 64GB memory. Running FCP project with color correction. Under Activity Monitor at top FCP shows %CPU as about 1400. Why does my 8 Core system not show 800 max %CPU if formula is #cores x 100?
The graph at bottom for CPU Load show System 3%, User 85-90%, Idle 7-10%.
Thanks.
Always look forward to the tips.
Sharon:
Good question. My language was imprecise because i7 and i9 computers support hyper-threading which doubles the apparent number of cores. If you open Activity Monitor > Window > CPU usage, you’ll see a graphic that displays the “separate” calculation devices on your CPU. These are either equal to the number of cores, or double the number of cores, depending upon the CPU.
Count the number of columns and multiply by 100%. That represents the maximum CPU % described in this tip.
Larry