Tip #1726: Change the Way You Tell Stories
… for Random Weirdness
Tip #1726: Change the Way You Tell Stories
Larry Jordan – LarryJordan.com
Innovation in story-telling is a winning audience strategy.

The website for the Radio/Television News Directors Association (RTNDA) presented this article, written by Mike Beaudet, Anna Campbell & John Wihbey, in RTNDA.com. This is a summary.
NOTE: This is part three in a four-part series looking at how television news and story-telling is changing in today’s world. The EXTRA CREDIT section at the end has links to all published parts.
In our research series here at RTDNA, we’ve been building the case that new forms of storytelling, particularly next-generation animation, are vital to meet new audience expectations and norms. In this post, we hope to provide an in-depth look at the data we gathered and the topline takeaways for how graphics and animation can enhance local TV news storytelling. We hope you’ll dive in and see there’s a powerful case for breaking the mold.
What are the general takeaways to consider as you consume this information? As we examine the data, we hope you’ll remember two themes in particular:
- Dealing with complexity: First, the current era demands a pivot from reacting to the news cycle to managing a protracted coverage cycle with an emphasis on context, trends, and outcomes. Graphics and animation assist in the understanding of more complex issues, as they can capture sequences of events, illustrate geography, aid in comparison, and connect the dots. They enable a deeper understanding, and a higher level of retention, of the facts at hand.
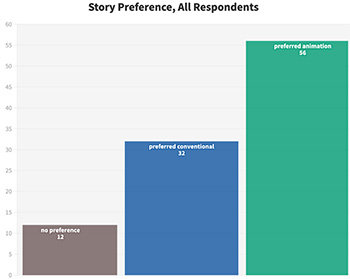
- Active audience choice: Second, local news consumers are taking a more active role in their news consumption, flowing between brands and platforms to get the content they need. The fragmentation of news and the decline in allegiance is as much a response to frustration as it is to motivation. Accordingly, our data suggest younger audiences are responding to strong visuals; we find strong preference for the animated approach, especially for the younger demographics (ages 18 to 24). Importantly, our research reveals that enhancing broadcasts with graphics and animation can both attract new viewers as well as continue to satisfy––and even impress––a station’s loyal core audience base, even in this volatile news environment.
We present these insights based not only on partnerships we facilitated with TV stations, but also on a rigorous experimental survey, conducted with more than 1,000 respondents across the Chicago and Boston markets.
Animation consistently helped viewers absorb information more efficiently, both by their own estimation and as evidenced by quantitative retention tests. Viewers indicated they felt that the animated stories more often included “the right amount of detailed information” as opposed to overloading them with granular detail or leaving them with more questions than answers. As one viewer put it, the animated version of a story about a super spreader event in Chicago “more clearly showed how many people [were] infected” with the coronavirus. A story about a small plane crashing off the freeway was described as “easy to follow” and “familiar” when maps and text-based graphics showing the location and time of the incident were added.
EXTRA CREDIT
Leave a Reply
Want to join the discussion?Feel free to contribute!